When copying charts into a word processor, whether in Microsoft Office from
Excel to
Word or in openoffice.org from
Calc to
Writer, the software embeds a special object that links back to the original spreadsheet. If you then change the details in the
Excel spreadsheet the
chart in the
Word document will change accordingly. In many cases this is advantageous; however, it can cause problems if the
Word document cannot 'see' the
Excel file, for example, if you email the
Word file to someone without the
Excel file. It is generally better to paste the chart as an image in the first place using the 'Paste special' facility.
I will start by explaining how to do this in Microsoft Office:
Once you have created your chart in
Excel you select it and copy it, as shown here.

In older versions of
Word you pull down the 'Edit' menu and select 'Paste Special'. You may have to wait a moment for all the menu items to be revealed.

In the latest versions of
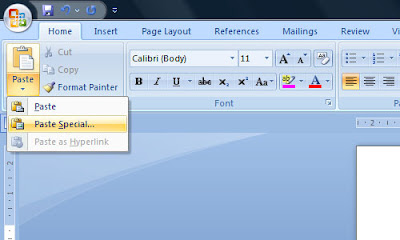
Word, 'Paste special' is in a menu underneath the 'Paste' button.

A box will open, from which you select 'Picture (Enhanced Metafile)', and click OK.

This will then insert the chart as a picture, which you can manipulate like any other imported image.

In openoffice.org, the procedure is pretty much the same as above, with 'Paste special' is in the 'Edit' menu, or alternatively you can use a keyboard shortcut:
Ctrl +
Shift +
V. The major difference from above is that the following box will open when you select 'Paste special'. Simply select 'Bitmap' and click OK to paste the chart as a picture.


